
China Bicycle Export Report 2025: Data, Trends & B2B Sourcing Strategy
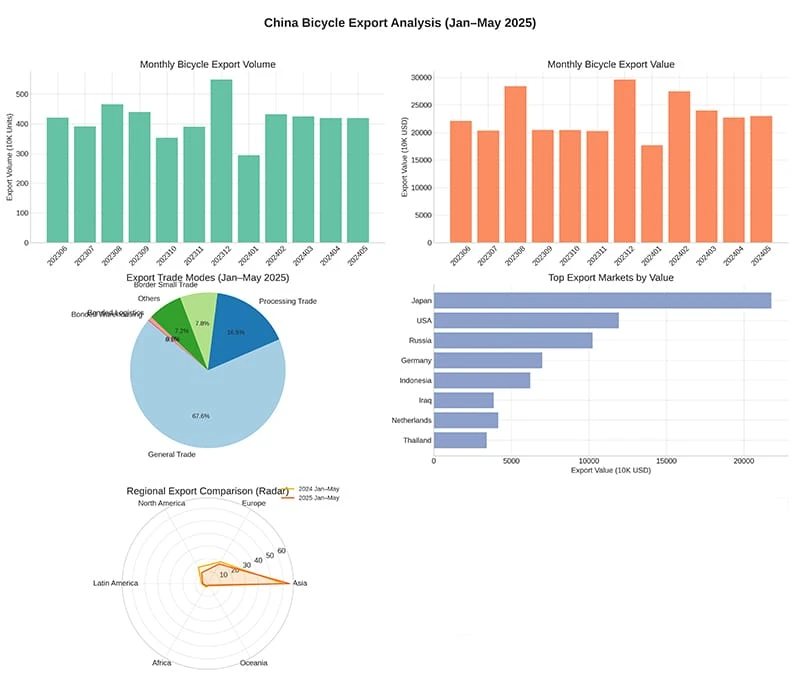
In 2025, the global landscape for bicycle sourcing is undergoing a pivotal shift. According to the latest trade statistics released by the General Administration of Customs of China (GACC), the industry is signaling a robust recovery in volume despite pricing headwinds. From January to May 2025, China exported 21.21 million complete bicycles, marking a 10.2% year-over-year increase.
For B2B wholesalers and brand owners, interpreting these numbers is crucial. While volume is up, the underlying value shift suggests a strategic pivot in the supply chain. This report analyzes the data to help you navigate sourcing decisions in Q3 and Q4.
📦 Export Data Analysis: Volume vs. Value
The data indicates a "Volume-Up, Price-Down" trend, a clear signal of market correction after years of supply chain volatility.
- Total Export Volume (Jan–May 2025): 21.21 million units (▲ 10.2%)
- Total Export Value: $1.214 billion (▲ 3.6%)
- Average Unit Price: $57.25 (▼ 6.0%)
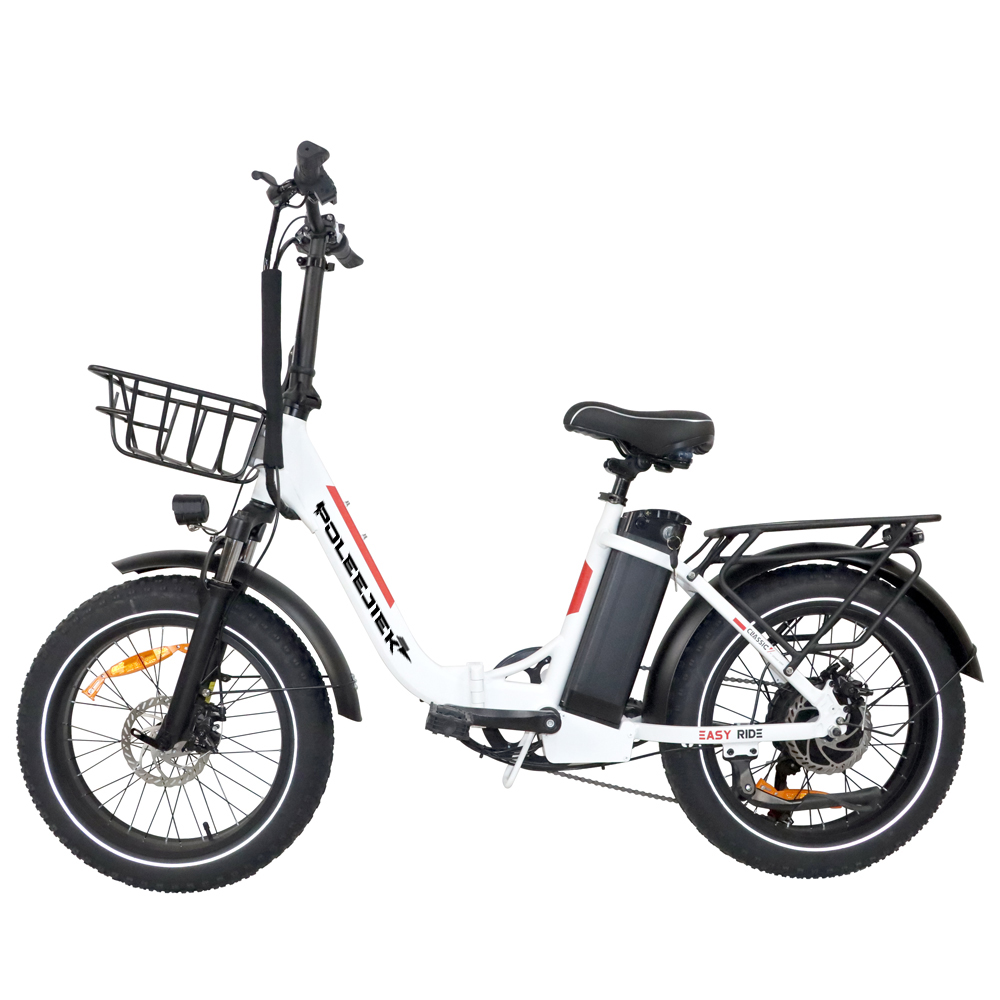
- Key Insight: The 6% drop in unit price isn't just about devaluation. It reflects stabilized raw material costs (aluminum/lithium) and a global shift toward entry-level foldable electric bikes to meet budget-conscious consumer demand.
🏭 Manufacturer's Insight
As a factory operating on the ground, Poleejiek observes that the price drop is also driven by aggressive inventory clearance in the supply chain. Pro Tip for Buyers: Now is the optimal time to lock in prices for 2026 models before raw material costs potentially rebound in Q4.
🌍 Top 5 Export Destinations (Jan–May 2025)
While traditional markets remain strong, the ranking reveals shifting geopolitical influences on trade flows.
| Market | Export Value (USD) | Market Trend Analysis |
|---|---|---|
| 1. Japan | $21.77 million | Stable demand for commuter bikes; high quality standards required. |
| 2. United States | $11.93 million | Significant decline due to tariff barriers; shifting to high-end niche models. |
| 3. Russia | $10.24 million | Rapid growth driven by cross-border logistics improvements. |
| 4. South Korea | $4.23 million | Focus on compact and urban mobility solutions. |
| 5. Netherlands | $4.15 million | Key hub for E-bike distribution into the wider EU market. |
📉 The U.S. Market Challenge: Tariffs & Strategy
The United States data requires specific attention. Exports have faced a sharp downturn—falling 70.7% in volume in May alone. This is directly attributed to the expiration of Section 301 tariff exclusions and the tightening of de minimis shipping rules.
This policy shift has created a vacuum in the affordable mid-drive electric bike segment. US-based importers are now prioritizing High-Value, Low-Volume orders to offset shipping and duty costs, or seeking semi-knocked-down (SKD) assembly solutions to navigate regulations.
📈 Opportunity: The Rise of Custom OEM
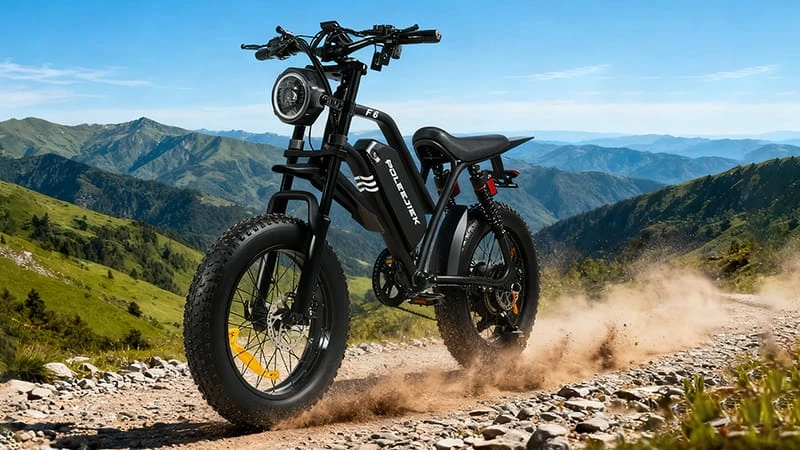
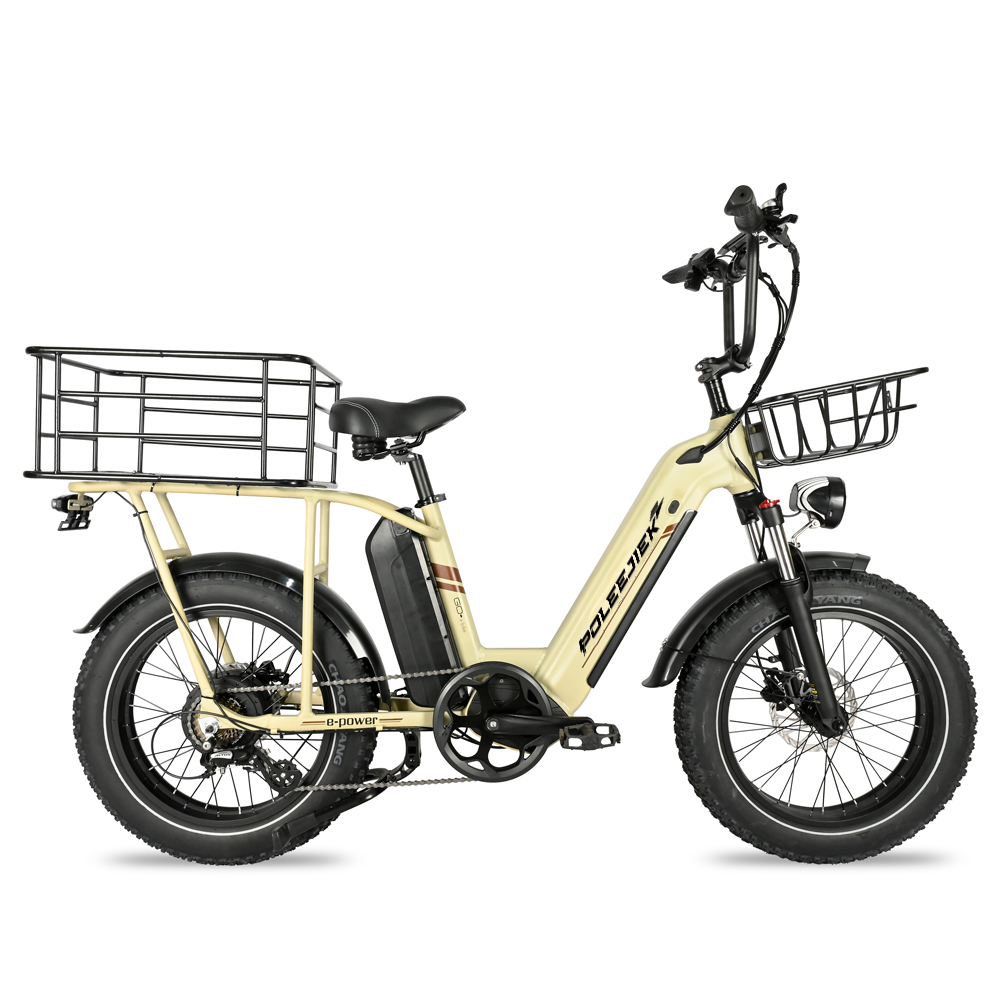
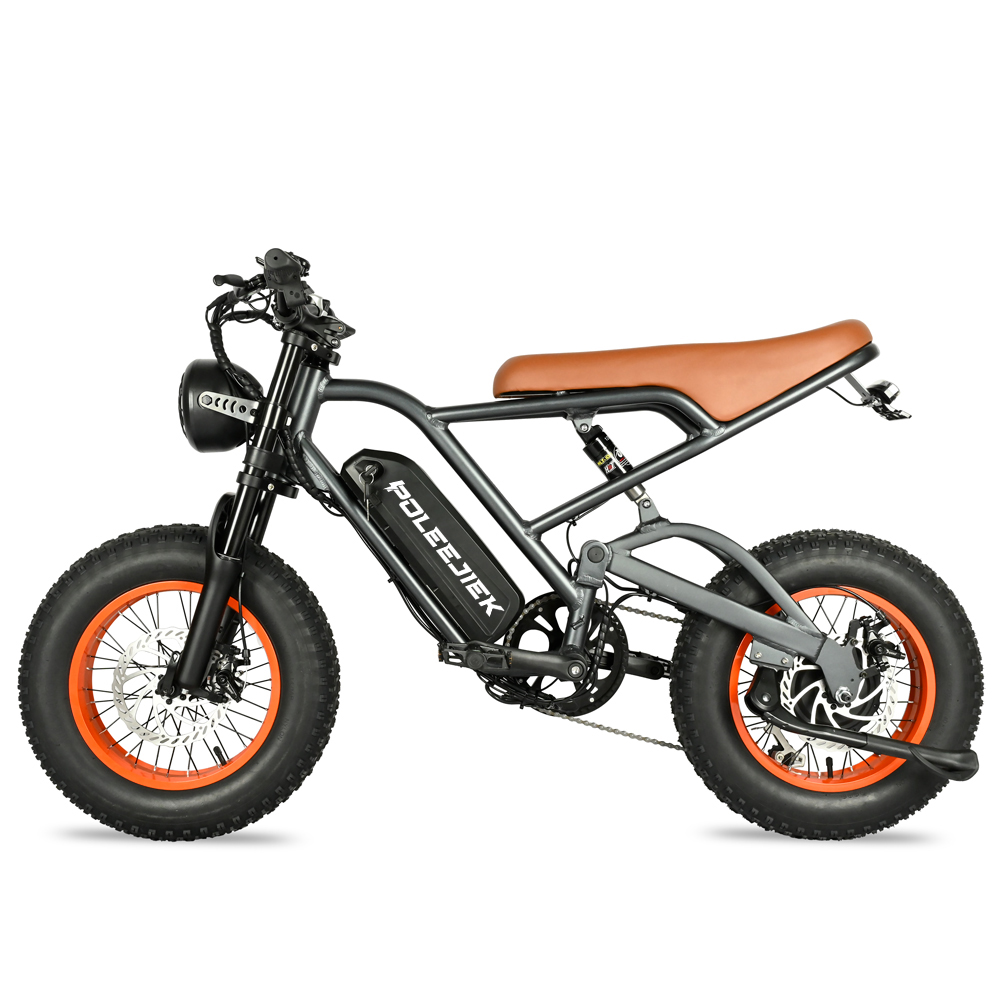
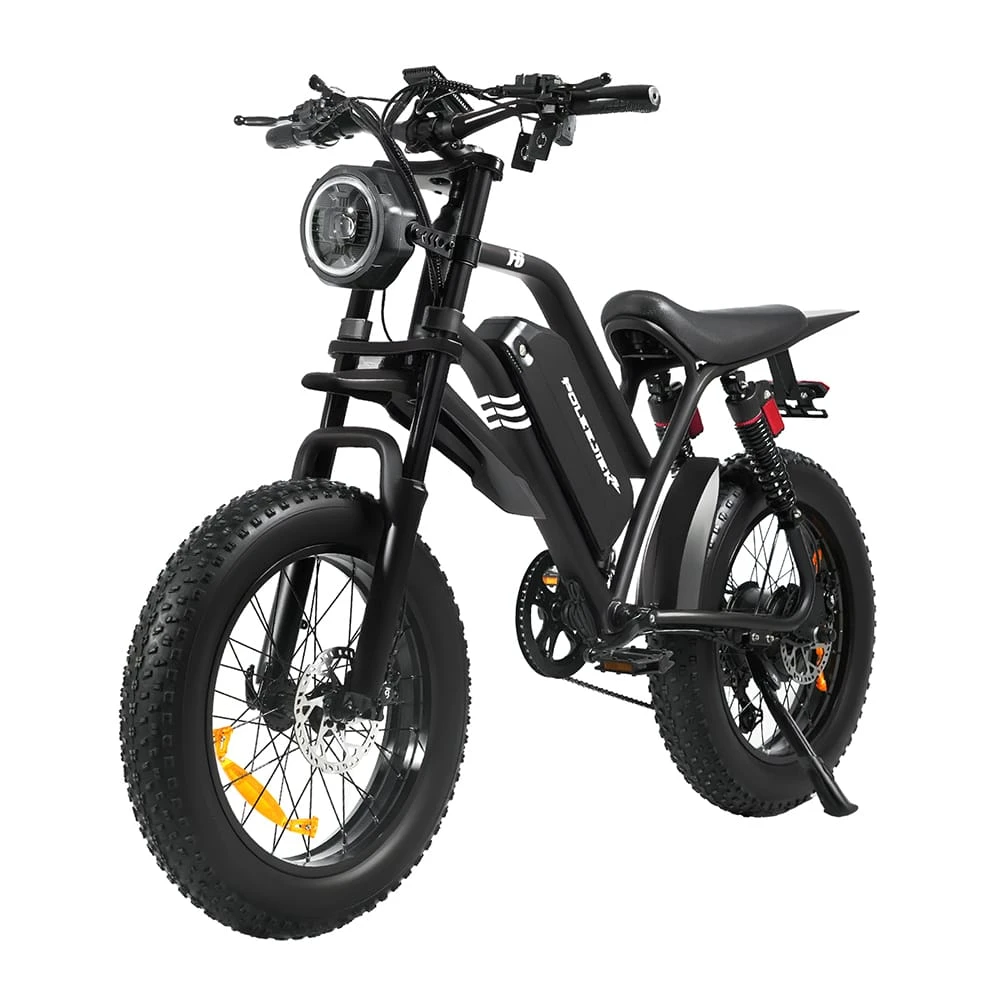
Despite regional challenges, the demand for differentiation is at an all-time high. Generic models are losing ground to specialized products. We are seeing a 40% increase in inquiries for customized Fat Tire E-Bikes tailored for specific terrains (e.g., snow in Russia, sand in coastal US).
🔄 Strategic Action Plan for B2B Buyers
- Diversify Supply Chains: Don't rely on a single market. Use China's manufacturing scale for global distribution, focusing on emerging markets like Russia and SE Asia.
- Invest in OEM Branding: In a price-sensitive market, brand identity is your margin protector. Utilize OEM services to create unique frames and specs that competitors cannot easily copy.
- Leverage "General Trade" Logistics: With 67.7% of exports moving via General Trade, logistics are more reliable than ever. Consolidate shipments to reduce per-unit freight costs.
Conclusion: Adapting to the 2025 Landscape
The 2025 data from China presents a clear narrative: The market is recovering, but the rules have changed. Success now depends on agility—moving away from generic "off-the-shelf" buying toward strategic OEM partnerships and compliant import strategies.
Need to navigate these changes?
Poleejiek provides expert OEM/ODM manufacturing to help you bypass market hurdles.
👉 Discuss Your 2026 Strategy With Us